Pacing in adaptations
May. 11th, 2025 05:57 pmPacing is a point that's repeatedly come up as I've been reviewing adaptations of Kidnapped. It's interesting to compare which parts of the story different adaptations choose to spend more or less time on, and frustrating that there seems to be a tendency to spend more time on what are IMO the less fannishly appealing and historically interesting parts of the story (viz., the Alan-less and non-Highland bits). Then I thought, this is something I can analyse with numbers and graphs!
I picked four key plot events—the kidnapping, the shipwreck, the murder and the quarrel—and noted the point in the story at which each occurs, in the original book and in each of the five full-length adaptations I've watched, read and listened to so far, as a proportion of the total length. For media with a page count, I took the page on which each event occurs and divided by the total number of pages; for media with a running time, I took the timestamp to the nearest minute and divided by the total running time in minutes.
Happily, these events divide the book up reasonably evenly. I could have gone the other way, deciding on exact fractions of the book's length, noting what specific part of the story corresponds to each fraction and then finding those bits in adaptations, but that wouldn't have worked very well because random non-plot-essential parts of the book are likely not to be included in adaptations, so it would be difficult to make fair comparisons. (In fact I encountered this problem once anyway: the 1917 film doesn't include the shipwreck. I decided the point where Alan and Davie steal the ship's boat and row away was the closest equivalent and used that instead.)
Here are the numbers:
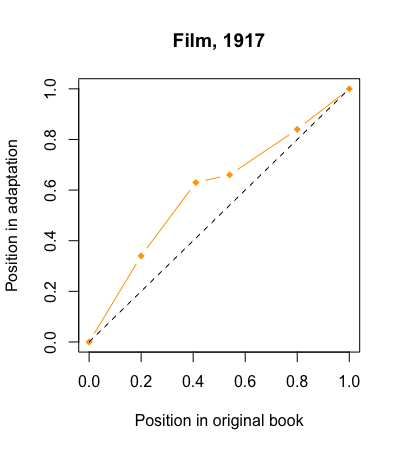
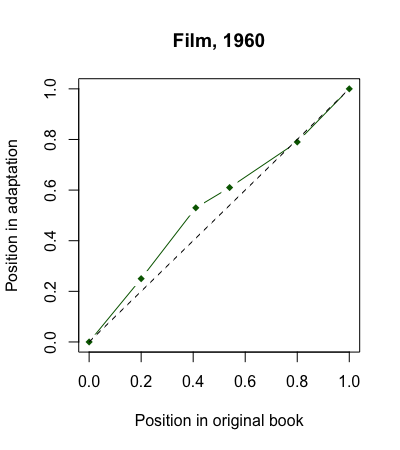
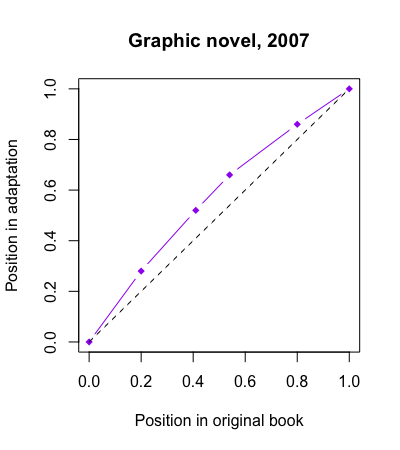
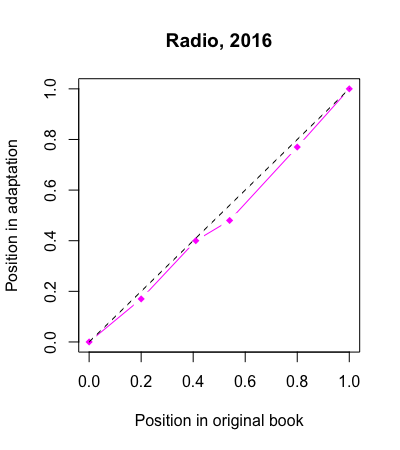
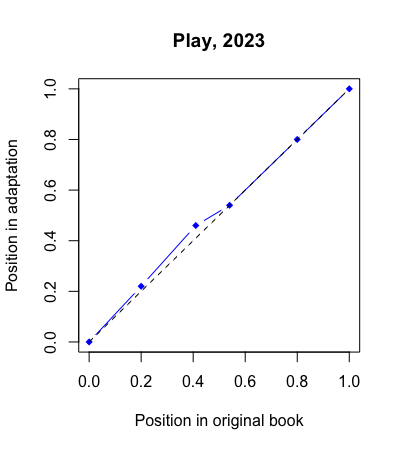
I find these much easier to interpret in graph form, so I made some graphs. These show each adaptation plotted against the book; the black dashed line is y=x, i.e. an adaptation with pacing identical to the book's would follow this line exactly. Where the coloured line has a steeper gradient than the black dashed line, the adaptation is spending more time on that part of the story than the book; where the gradient is shallower, the adaptation is speeding faster through the story relative to the book. I've added points at (0,0) and (1,1) for neatness (although it could be argued that this isn't really legitimate: the play certainly doesn't end at the same point as the book, for instance).
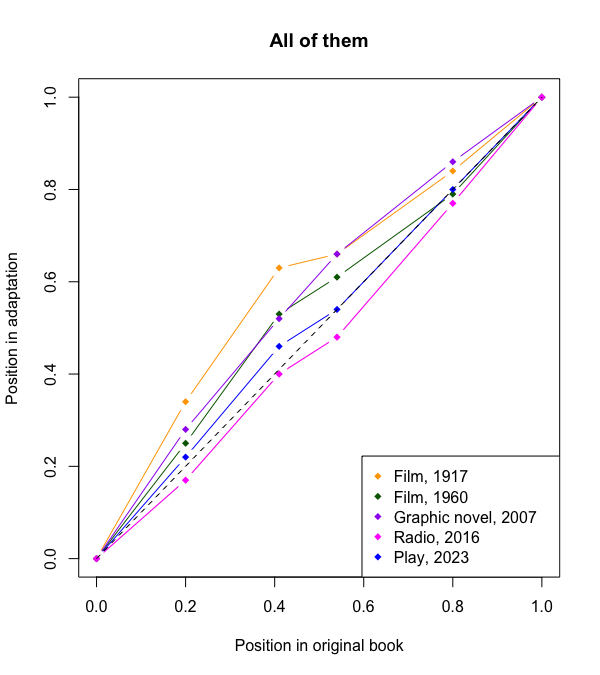
And here they are all together, for ease of comparison:
I was right: there is a definite trend for steeper gradients in the early part of the book, with four out of five adaptations being above the y=x line at the middle of the story; though the ship rather than the pre-kidnapping section seems to be the most appealing, which I think goes along with the way adaptations often focus on the 'swashbuckling adventure on the high seas!' aspect of the story. The 1917 film, as I thought when I watched it, is particularly extreme; the 2016 radio play, darling that it is, bucks the trend, stays below y=x throughout and is at its steepest in the Highlands; all the adaptations (ETA: except the graphic novel) have their shallowest gradient between the shipwreck and the murder, which makes sense (Earraid is difficult to do in a medium that doesn't have narration; Mull and Morven are interesting but not plot-vital and perhaps less appealing to audiences).
And, for all its substantial departures from the book in style and presentation, the 2023 play is the most faithful of these adaptations in its pacing! It spends a bit more time on the ship, but catches up in the middle section, and the points in the second act match the book almost exactly. I wasn't expecting that, and it's cool and interesting to see.
This is a very fun and instructive way to look at adaptations! I'll revisit it as I continue with more adaptations and add graphs for the other ones I read, watch and listen to. And now I'm thinking what other oft-adapted books you could do this for, and what conclusions might be drawn...
I picked four key plot events—the kidnapping, the shipwreck, the murder and the quarrel—and noted the point in the story at which each occurs, in the original book and in each of the five full-length adaptations I've watched, read and listened to so far, as a proportion of the total length. For media with a page count, I took the page on which each event occurs and divided by the total number of pages; for media with a running time, I took the timestamp to the nearest minute and divided by the total running time in minutes.
Happily, these events divide the book up reasonably evenly. I could have gone the other way, deciding on exact fractions of the book's length, noting what specific part of the story corresponds to each fraction and then finding those bits in adaptations, but that wouldn't have worked very well because random non-plot-essential parts of the book are likely not to be included in adaptations, so it would be difficult to make fair comparisons. (In fact I encountered this problem once anyway: the 1917 film doesn't include the shipwreck. I decided the point where Alan and Davie steal the ship's boat and row away was the closest equivalent and used that instead.)
Here are the numbers:
| Point | Original book | Film, 1917 | Film, 1960 | Graphic novel, 2007 | Radio, 2016 | Play, 2023 |
|---|---|---|---|---|---|---|
| Kidnapping | 0.20 | 0.34 | 0.25 | 0.28 | 0.17 | 0.22 |
| Shipwreck | 0.41 | 0.63 | 0.53 | 0.52 | 0.40 | 0.46 |
| Murder | 0.54 | 0.66 | 0.61 | 0.66 | 0.48 | 0.54 |
| Quarrel | 0.80 | 0.84 | 0.79 | 0.86 | 0.77 | 0.80 |
I find these much easier to interpret in graph form, so I made some graphs. These show each adaptation plotted against the book; the black dashed line is y=x, i.e. an adaptation with pacing identical to the book's would follow this line exactly. Where the coloured line has a steeper gradient than the black dashed line, the adaptation is spending more time on that part of the story than the book; where the gradient is shallower, the adaptation is speeding faster through the story relative to the book. I've added points at (0,0) and (1,1) for neatness (although it could be argued that this isn't really legitimate: the play certainly doesn't end at the same point as the book, for instance).
And here they are all together, for ease of comparison:
I was right: there is a definite trend for steeper gradients in the early part of the book, with four out of five adaptations being above the y=x line at the middle of the story; though the ship rather than the pre-kidnapping section seems to be the most appealing, which I think goes along with the way adaptations often focus on the 'swashbuckling adventure on the high seas!' aspect of the story. The 1917 film, as I thought when I watched it, is particularly extreme; the 2016 radio play, darling that it is, bucks the trend, stays below y=x throughout and is at its steepest in the Highlands; all the adaptations (ETA: except the graphic novel) have their shallowest gradient between the shipwreck and the murder, which makes sense (Earraid is difficult to do in a medium that doesn't have narration; Mull and Morven are interesting but not plot-vital and perhaps less appealing to audiences).
And, for all its substantial departures from the book in style and presentation, the 2023 play is the most faithful of these adaptations in its pacing! It spends a bit more time on the ship, but catches up in the middle section, and the points in the second act match the book almost exactly. I wasn't expecting that, and it's cool and interesting to see.
This is a very fun and instructive way to look at adaptations! I'll revisit it as I continue with more adaptations and add graphs for the other ones I read, watch and listen to. And now I'm thinking what other oft-adapted books you could do this for, and what conclusions might be drawn...